Ever wish you had an easier way to analyze spreadsheet data and pinpoint the most effective solution? Download our free practice file and discover how Excel’s Solver add-in can unlock more efficient problem-solving. This easy-to-follow guide will walk you through a simple example to reveal Solver’s power, from setting up your data to finding the optimal solution.
Knowledge You’ll Gain
- Understanding Solver: Grasp the fundamentals of Excel Solver and its capabilities for problem-solving.
- Installing Solver: Learn how to get the add-on if it’s not already installed.
- Setting Up Solver: Learn how to input your data, define constraints, and set objectives.
- Learning Solving Methods: Discover the different solving methods available (GRG Nonlinear, Simplex LP, and Evolutionary)
- Applying Solver to a Scenario: See an example of how Solver can be used.
What is Excel Solver?
The Excel Solver add-in is designed to do more complex “what-if” calculations using different solving methods. The main advantage is Solver allows you to work with variables and constraints to find an optimal solution.
If you recall my Excel Goal Seek tutorial, my total vote count increased. That was the problem. With this enhanced solving method, I can ask Excel Solver to tell me how the YES/NO vote count needed to change to win an election while not altering the total vote count.
To solve this problem, you need to define certain cell types. I’ve added background colors and callouts to my example. I find adding the color helps me later when I enter variables and values into the Solver Parameters dialog box.
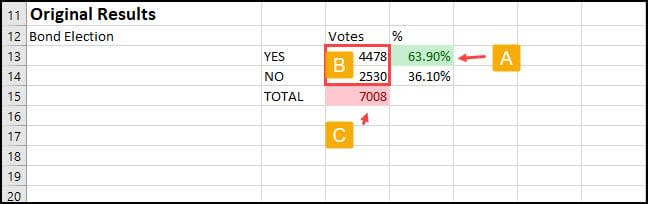
[A] Objective Cell – A single cell on the active worksheet that represents my goal. Currently, the value is 63.90%. I want to change this value to the required winning percentage.
[B] Variable Cell – This can be one or more cells that Solver will change to achieve the desired objective. It can be a range of cells or nonadjacent cells. Solver will run through its calculations by adjusting the YES/NO counts until it finds the optimal solution. You’re allowed up to 200 variable cells.
In my example, I have 2 adjacent values. However, you might have a problem where your variables are not next to each other. In this case, you can hold down your CTRL key and click or separate the cells by a comma.
[C] Constraint Cell – This is an optional but essential cell. As the name suggests, it limits the solution to specific criteria. Your spreadsheet can have more than one constraint. In our case, the TOTAL vote count has to stay the same at 7008. No stuffing the ballot box with additional YES votes. Other constraint types might include integers or minimum values.
Solver Parameters: An Overview
We’ll use these cell references in the Solver Parameters dialog, as shown below. Let’s use my election results as an Excel Solver example. Don’t worry as I’ll explain all of this and then provide the steps for the practice sheet.
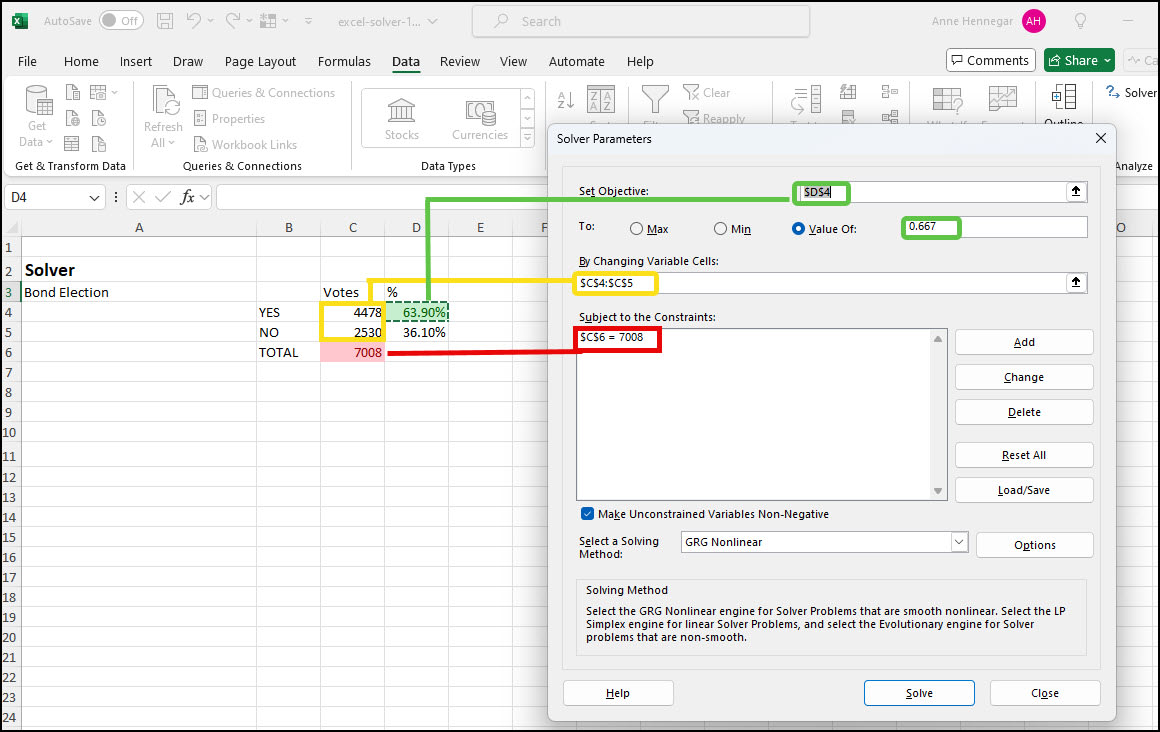
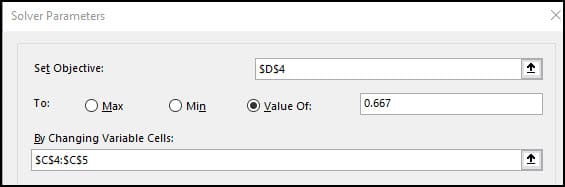
The first field is the Set Objective. Once you click in the text box, click your desired Excel cell. It will be carried over as an absolute reference with the $ anchors. In earlier versions of Solver, Excel called this field the target cell. So our value is $D$4.
Underneath, you’ll see a To: line with three radio buttons. In my scenario, I want to test for a Value Of 66.7% which is the required winning percentage. However, I can’t type a % sign in this field, so I’ll use the decimal value. Once Solver completes its iterations this new value will replace the original. That’s why I’ve shown both in green.
Now that we’ve told Excel our objective is to get 66.7% of the YES votes, I need to define my variables and which cells can be changed. So, again, I clicked in the By Changing Variable Cells: field and highlighted cells C4:C5.
The last item I defined was my constraint. This is done by clicking the Add button on the lower right side. Looking under the Subject to the Constraints: section, you’ll see I’m telling Excel to keep the total vote count at 7008.
I also kept the default Solving Method of GRG Nonlinear. However, there are more complex methods using linear programming solutions.
How to Install Excel Solver
I’m unsure why Solver in Excel isn’t installed by default. It’s an add-on.
- Open Microsoft Excel.
- From the File menu, select Options.
- In the Excel Options dialog box, click Add-ins from the left menu.
- Look down to the bottom right side for a field called Manage:
- Select Excel Add-ins from the drop-down list.
- Click the Go… button.
- From the Add-ins dialog box, check the box for Solver Add-in.
- Click OK.
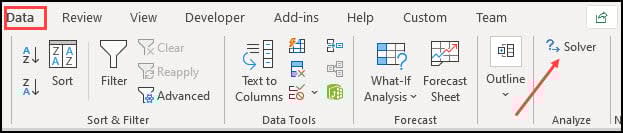
If you go to your Data tab, you should see Solver in the Analyze section.
How to Use Solver in Excel
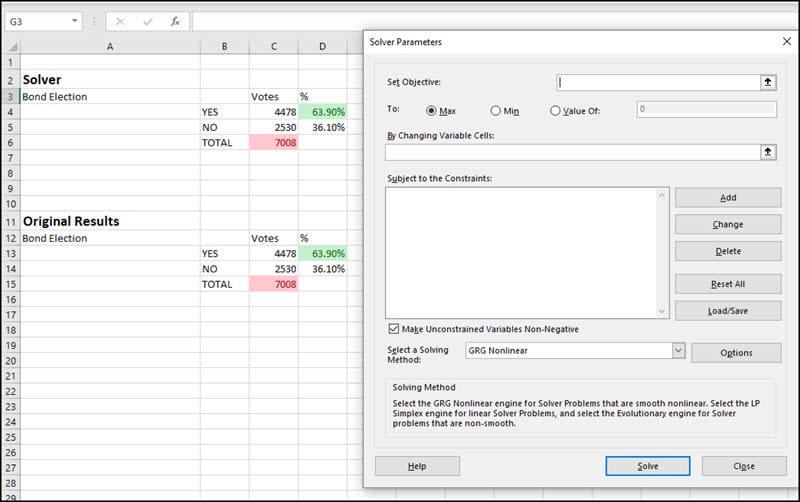
The steps below were done using Microsoft 365 and the practice spreadsheet below. The spreadsheet has two versions of the election results, so you can use Solver on one and view the original results. Once you learn the tool, you can skip adding a second version.
- Download and open the practice file.
- You may need to click the Enable Editing button on the Protected View banner.
- Click cell G3. There is no magic to this cell reference except that it opens Solver closer to my data.
- Click the Data tab.
- From the Analyze group, click Solver.
- The Solver Parameters dialog box appears. You can reposition it on your screen.
- Click in the Set Objective box and then click cell D4.
- Toggle the Value Of: radio button.
- Replace the “0” value with 0.667.
- Click in the By Changing Variable Cells: field.
- Highlight cells C4:C5. Excel will convert these to an absolute reference.
- Move to the Constraints area and click the Add button on the right. The Add Constraint dialog opens.
- Click in the Cell Reference field.
- Click cell C6. Excel will automatically populate the field.
- Move to the next field and select = from the drop-down menu.
- In the Constraint: field type 7008 since we want to match the total votes count.
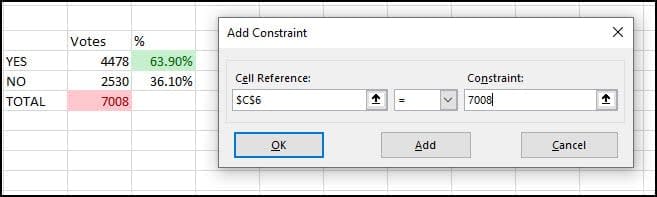
- Click the OK button since we only have one constraint.
- Click the Solve button. Excel will attempt to find the optimal solution.
- The Solver Results dialog opens, and your spreadsheet values in C4:C5 should’ve changed. Also, the Total % has increased to our target value of 66.70%.
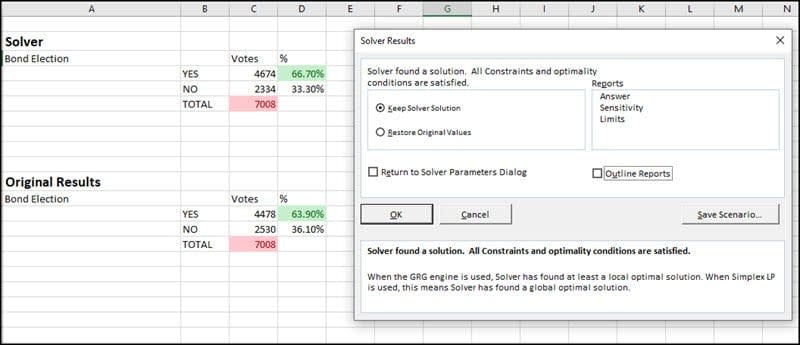
- Click OK to accept the new solution.
If you do the math, you can see this ballot measure could’ve had a different outcome if 196 people had voted “yes” instead of “no.” Or if more people voted.
Exploring More Solver Features
The analysis add-in can do some sophisticated optimization analysis using the other radio button options like Max and Min. Microsoft has a tutorial on using Solver to determine the optimal product mix. It’s much more detailed than this article and includes using the SUMPRODUCT function and a linear solving method.
As you learn how to use Solver, you’ll discover more options than this simple example. For example, the Excel Solver function allows you also to load and save optimization scenarios. It also has a report section that provides additional details.
Test Your Knowledge
Below are 4 questions regarding the article you just read. Read each question and see if you know the answer. Then click the green marker to see the answer.
Q: What is the purpose of Excel Solver?
Answer: To find the optimal solution to a problem by adjusting variables given a set of constraints.
Q: Name 2 essential components to set up Solver?
Answer: Objective cell and Variable cells.
Q: Do the variable cells have to be adjacent?
Answer: No
Q: True or False: Solver requires you to set constraints?
Answer: False. Constraints are optional and you can have multiple constraints.